Alpine gravel-bed rivers are of European interest due to 2 directives: Habitats Directive and Water Framework Directive. Regarding Habitats Directive three typical habitats are listed and can be seen as a succession from highly dynamic (3220 Alpine rivers and the herbaceous vegetation along their banks) to medium dynamic (3230 Alpine rivers and their ligneous vegetation with Myricaria germanica) and moderately dynamic (3240 Alpine rivers and their ligneous vegetation with Salix elaeagnos) pioneer sites.
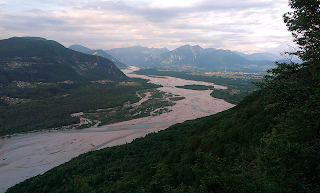
Let's have a look from the orbit at one of the last near natural alpine gravel-bed rivers in the Eastern Alps: Tagliamento.
 |
| View to North from Monte Ragogna over Tagliamento's riverine landscape (photo: H. Kudrnovsky) |
Ingedients:
Landsat 8 Operational Land Imager (OLI) and Thermal Infrared Sensor (TIRS) images consist of nine spectral bands with a spatial resolution of 30 meters for Bands 1 to 7 and 9. New band 1 (ultra-blue) is useful for coastal and aerosol studies. New band 9 is useful for cirrus cloud detection. The resolution for Band 8 (panchromatic) is 15 meters. Thermal bands 10 and 11 are useful in providing more accurate surface temperatures and are collected at 100 meters. Approximate scene size is 170 km north-south by 183 km east-west.Landsat 8 data is available for download at no charge (e.g. Earth Explorer) and with no user restrictions.
First download Landsat 8 data and do a data check by gdalinfo:
Driver: GTiff/GeoTIFFLandsat 8 data is organized in UTM zones; here along the catchment of river Tagliamento UTM zone 32N. Import or link the data into a GRASS location created with EPSG: 32632 (UTM zone 32N).
Files: LC81920282015221LGN00_B1.TIF
Size is 7651, 7771
Coordinate System is:
PROJCS["WGS 84 / UTM zone 32N",
GEOGCS["WGS 84",
DATUM["WGS_1984",
SPHEROID["WGS 84",6378137,298.257223563,
AUTHORITY["EPSG","7030"]],
AUTHORITY["EPSG","6326"]],
PRIMEM["Greenwich",0],
UNIT["degree",0.0174532925199433],
AUTHORITY["EPSG","4326"]],
PROJECTION["Transverse_Mercator"],
PARAMETER["latitude_of_origin",0],
PARAMETER["central_meridian",9],
PARAMETER["scale_factor",0.9996],
PARAMETER["false_easting",500000],
PARAMETER["false_northing",0],
UNIT["metre",1,
AUTHORITY["EPSG","9001"]],
AUTHORITY["EPSG","32632"]]
 |
| Band 8 – Panchromatic (resolution 15m x 15m) |
i.landsat.toar -p input=LC81920282015221LGN00_B output=landsat_toar metfile=LC81920282015221LGN00_MTL.txt lsatmet=number,creation,date,sun_elev,sensor,bands,sunaz,timeThe -p flag of the i.landsat.toar tool prints metadata info like sun azimuth, sun zenit (=elevation) and others.
number=8
creation=2015-08-09
date=2015-08-09
sun_elev=55.616710
sensor=OLI/TIRS
bands=11
sunaz=144.774232
Further i.landsat.toar is used to transform the calibrated digital number of Landsat imagery products to top-of-atmosphere radiance or top-of-atmosphere reflectance and temperature. Optionally, it can be used to calculate the at-surface radiance or reflectance with atmospheric correction (DOS method). Atmospheric correction could also be done later by the dedicated i.atcorr tool.
Let's do the transformation with an atmospheric correction:
i.landsat.toar --verbose input=LC81920282015221LGN00_B output=dos1_corr_toar metfile=LC81920282015221LGN00_MTL.txt sensor=oli8 method=dos1By i.colors.enhance an auto-balancing of colors for RGB images is performed.
i.colors.enhance red=dos1_corr_toar4 green=dos1_corr_toar3 blue=dos1_corr_toar2
 |
| RGB image (resolution 30m x 30m) |
Habitat 3220 Alpine rivers and the herbaceous vegetation along their banks is typical for slightly vegetated gravel banks. Such sites often shows a high albedo. i.albedo computes broad band albedo from surface reflectance. In order to speed up computation time, e.g. the river (e.g. extracted from Natural Earth) can be buffered and a mask set by this buffer.
i.albedo -l -c --verbose input=dos1_corr_toar2,dos1_corr_toar3,dos1_corr_toar4,dos1_corr_toar5,dos1_corr_toar6,dos1_corr_toar7 output=tag_albedo_aggressivemode
 |
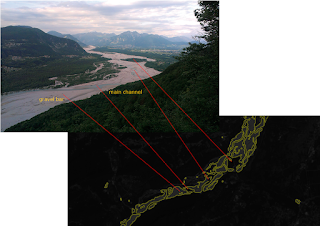
| i.albedo result; albedo raster values above a manually chosen threshold (here e.g. 0.19) clumped and vectorized |
 |
| vectorized albedo above threshold 0.19 overlayed over a RGB image |
The normalized difference vegetation index (NDVI) is a simple graphical indicator that can be used to analyze remote sensing measurements and assess whether the target being observed contains live green vegetation or not.
i.vi red=dos1_corr_toar4 output=vi_nvdi viname=nvdi nir=dos1_corr_toar5 green=dos1_corr_toar3 blue=dos1_corr_toar2 band5=dos1_corr_toar6t band7=dos1_corr_toar7
 |
| vectorized albedo above threshold 0.19 overlayed over a NDVI map |
 |
| vectorized albedo above threshold 0.19 overlayed over a panchromatic Landsat 8 image |
 |
| linking albedo analysis with nature |
As the Landsat 8 satellite images the entire Earth every 16 days in an 8-day offset from Landsat 7, temporal and spatial analysis of alpine rivers and their gravel bed riverine landscape may be viable over large scale.
Combining available open source software (e.g. GRASS GIS, QGIS, Orfeo ToolBox) with open data (e.g. Landsat, Sentinel) tweaked by ground proofing may support to fulfill the targets of the EU directives (Habitats Directive, Water Framework Directive): sustainable water use and biodiversity preservation.


